Раздел "Обзор"/en: различия между версиями
Новая страница: «"Overview" section» |
Новая страница: «=== '''Zone "Server traffic statistics for the current day"''' === "Server Traffic Statistics for the Current Day" Area provides a brief overview of the incoming and outgoing traffic in the personal account for the day. center|thumb|General view of the "Traffic statistics for the current day" zone|800px The traffic statistics for the current day are divi...» |
||
| (не показаны 3 промежуточные версии этого же участника) | |||
| Строка 1: | Строка 1: | ||
== '''"Overview" section''' == | |||
== ''' | In the SmartPlayer personal account, the key section for any user is the "Overview" section. This section is essentially the main page for any user. <br> | ||
The entire section is divided into a large number of zones that provide various information for the user about their personal account. All these zones will be described below on this page. | |||
=== '''Zone "Device Summary"''' === | |||
=== ''' | The "Device Summary" zone provides a brief overview of the number of devices used by this company/user. All used devices have specific statuses. | ||
[[File:Общий_вид_зоны_сводка_по_устройствам.png|center|thumb|General view of the "Device Summary" zone|800px]] | |||
[[File:Общий_вид_зоны_сводка_по_устройствам.png|center|thumb| | Device statuses used in this zone: | ||
* Online - marked in green and shows the number of online devices. | |||
* | * Offline - marked in black and shows the number of offline devices. | ||
* | * Error - marked in red and shows the number of devices that encountered an error during operation. | ||
* | * Virtual - marked in gray and shows the number of used virtual devices. | ||
* | * In drafts - marked in gray and displays devices added using a special distribution. This distribution connects devices to the server. | ||
* | There is also an information line with the total number of devices in the company. | ||
[[File:Количество_устройств.png|center|thumb|Row "Number of devices"|800px]] | |||
[[File:Количество_устройств.png|center|thumb| | === '''Zone "Gas Station Columns Summary"''' === | ||
The "Gas Station Columns Summary" zone provides a brief overview of the number of gas station columns used by this company/user. All used devices have specific statuses. | |||
[[File:Общий_вид_зоны_сводка_по_Стелам.png|center|thumb|General view of the area "Summary of gas station steles"|800px]] | |||
=== ''' | Statuses used in this zone: | ||
* Online - marked in green and shows the number of columns online. | |||
[[File:Общий_вид_зоны_сводка_по_Стелам.png|center|thumb| | * Offline - marked in black and shows the number of columns offline. | ||
* Error - marked in red and shows the number of columns that encountered an error during operation. | |||
* | * Updating - marked in gray and shows the number of columns being updated. | ||
* | * Not activated - marked in gray and shows the number of non-activated columns. | ||
* | There is also an information line with the total number of columns in the company. | ||
* | [[File:Количество_устройств_азс.png|center|thumb|Line "Number of gas station steles"|800px]] | ||
* | === '''Zone "Schedule Summary"''' === | ||
The "Schedule Summary" zone provides a brief overview of the number of schedules used on the devices of this company/user. The displayed information is divided into three main blocks and one additional block. | |||
[[File:Количество_устройств_азс.png|center|thumb| | [[File:Общий_вид_зоны_сводка_расписаний.png|center|thumb|General view of the "Schedule Summary" zone|800px]] | ||
=== ''' | Main blocks: | ||
* Total schedules - displays the total number of schedules on all devices of the company/user. | |||
[[File:Общий_вид_зоны_сводка_расписаний.png|center|thumb| | * Devices without a schedule - displays the total number of devices without schedules at the company/user. | ||
* Schedules for today - displays the number of schedules used today on the devices of the company/user. | |||
* | The additional block is called - "Number of schedules on devices". | ||
* | [[File:Количество_расписаний_на_устройств.png|center|thumb| Line "Number of schedules per device"|800px]] | ||
* | === '''"Storage Usage Statistics" Area''' === | ||
The "Storage Usage Statistics" area provides a brief summary of the use of internal storages in the company/user's personal account. The displayed information will be divided into statistical and functional. | |||
[[File:Количество_расписаний_на_устройств.png|center|thumb| | [[File:Общий_вид_зоны_статистика_использования_хранилищ.png|center|thumb|General view of the "Storage usage statistics" zone|800px]] | ||
Statistical Information: | |||
* Content - the total volume of content used within the storage. Measured in GB. Graphically marked in blue on the scale. | |||
=== ''' | * Media Files of Devices and Groups - the total volume of media content located directly on the server itself. This data is not in the SmartPlayer system. Measured in GB. Graphically marked in turquoise on the scale. | ||
* Other - the total volume of files that do not fall under the main categories. It includes: OS, system files, third-party programs. Measured in GB. Graphically marked in bright green on the scale. | |||
[[File:Общий_вид_зоны_статистика_использования_хранилищ.png|center|thumb| | * Reserved - the total volume of unallocated memory. Measured in GB. Graphically marked in gray on the scale. | ||
* Widget Preview Folder - the total volume allocated for the widget preview function. Measured in GB. Graphically marked in light green on the scale. | |||
* | * Screenshot Folder - the total volume allocated for screenshots. Measured in GB. Graphically marked in green on the scale. | ||
* | * Content Playback Statistics - the total volume allocated for information related to the data being played. Measured in GB. Graphically marked in dark green on the scale. | ||
* | Scale Statistical Information: | ||
* | Used - the total volume of used memory. Marked in blue on the scale. | ||
* | Free - the total free memory volume. Marked in white on the scale. | ||
* | [[File:Функциональная_часть_зоны.png|center|thumb|Functional part of the "Storage usage statistics" zone|800px]] | ||
* | The functional part is represented by three capabilities: | ||
* Delete Widget Preview Files - deletes data from the widget preview folder and resets the counter. | |||
* Delete Screenshot History - deletes data from the screenshot folder, which were obtained from the device, and resets the counter. | |||
* Delete Unused Content - deletes content that has not been used in the system for more than two weeks. | |||
[[File:Функциональная_часть_зоны.png|center|thumb| | === '''Zone "Server traffic statistics for the current day"''' === | ||
"Server Traffic Statistics for the Current Day" Area provides a brief overview of the incoming and outgoing traffic in the personal account for the day. | |||
* | [[File:Общий_вид_зоны_статистика_трафика_за_текущий_день.png|center|thumb|General view of the "Traffic statistics for the current day" zone|800px]] | ||
* | The traffic statistics for the current day are divided into two areas: | ||
* | Incoming Traffic - the volume of information coming into the personal account. | ||
* Outgoing Traffic - the volume of information sent from the personal account. | |||
Hovering over one of the areas highlights it and provides detailed information about specific traffic volumes.<br> | |||
=== ''' | Within this area, there is a clickable button in the bottom right labeled "More Statistics". Clicking on it will open a window where you need to set the parameters for the report.<br> | ||
The report parameters include:: | |||
[[File:Общий_вид_зоны_статистика_трафика_за_текущий_день.png|center|thumb| | * Start Date - the starting point for creating the report. | ||
* End Date - the ending point for creating the report. | |||
After setting these parameters, you can click the "Create Report" button, and the system will compile and gather data for the intervals set by the user. If this action is not needed, you can click the "Close" button.<br> | |||
* | After compiling the report, the user will be redirected to another page with traffic reports. | ||
[[File:Список_отчётов_трафик.png|center|thumb|Traffic report page | |||
|800px]] | |||
After creating a report, you can click on it and perform several actions in the right toolbar: | |||
* | * Download Report | ||
* | * Delete Report | ||
* Close Toolbar Window | |||
=== '''User Summary Zone''' === | |||
[[File:Список_отчётов_трафик.png|center|thumb| | "User Summary" Area provides a brief overview of user data. | ||
[[File:Общий_вид_зоны_сводка_о_пользователе.png|center|thumb|General view of the "User Summary" zone|800px]] | |||
* | This data includes: | ||
* | * Email - the email address associated with the personal account | ||
* | * Username - the user's name within the personal account | ||
=== ''' | * Last Login - indicates the date of the last login | ||
* Administrator Roles - the role assigned to the user in the personal account | |||
[[File:Общий_вид_зоны_сводка_о_пользователе.png|center|thumb| | In this area, there is information about the total number of users in the company. It is located in the bottom right of this zone. | ||
[[File:Количество_пользователей.png|center|thumb|Information about the total number of users in the company|800px]] | |||
* | === '''"Active Sessions" Area''' === | ||
* | The "Active Sessions" area provides a brief overview of users accessing the personal account. | ||
* | [[File:Общий_вид_зоны_активные_сессии.png|center|thumb|General view of the "Active Sessions" zone|800px]] | ||
* | This information includes: | ||
* IP Address - logs the user's IP address | |||
[[File:Количество_пользователей.png|center|thumb| | * Tabs - indicates the number of open tabs | ||
* User Agent - provides brief information about the user's system and browser | |||
Also, if several users access the personal account simultaneously, all of them and their data will be reflected in this area simultaneously. | |||
=== ''' | === '''General information area''' === | ||
The "General Information" Area includes clickable buttons and overview data. | |||
[[File:Общий_вид_зоны_активные_сессии.png|center|thumb| | [[File:Общий_вид_зоны_общая_информация.png|center|thumb|General view of the "General Information" zone|800px]] | ||
The clickable buttons include: | |||
* | * Documentation - a link that redirects to the official SmartPlayer Wiki. Located at the bottom left of the page. | ||
* | * Refresh - this button updates the server information. Located at the bottom left. Updates automatically every 10 minutes, as indicated next to the button. The timer resets when navigating to another section and returning back to the "Overview" section, as well as when refreshing the page (pressing the "F5" key).<br> | ||
* User Agent - | In this area, there's also a warning about passwords, indicating that all users will be logged out and "kicked out" of all sessions when the password is changed. | ||
[[File:Выход_из_всех_сессий.png|center|thumb|Warning information. Located at the bottom right.|800px]] | |||
=== ''' | == '''Final Result''' == | ||
The user knows and understands the information provided by the "Overview" section of the personal account and knows how to utilize the features of this section. | |||
[[File:Общий_вид_зоны_общая_информация.png|center|thumb| | |||
* | |||
* | |||
[[File:Выход_из_всех_сессий.png|center|thumb| | |||
== ''' | |||
Текущая версия от 13:07, 9 октября 2023
"Overview" section
In the SmartPlayer personal account, the key section for any user is the "Overview" section. This section is essentially the main page for any user.
The entire section is divided into a large number of zones that provide various information for the user about their personal account. All these zones will be described below on this page.
Zone "Device Summary"
The "Device Summary" zone provides a brief overview of the number of devices used by this company/user. All used devices have specific statuses.
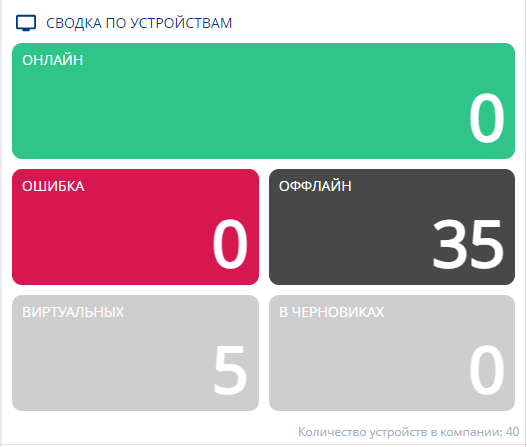
Device statuses used in this zone:
- Online - marked in green and shows the number of online devices.
- Offline - marked in black and shows the number of offline devices.
- Error - marked in red and shows the number of devices that encountered an error during operation.
- Virtual - marked in gray and shows the number of used virtual devices.
- In drafts - marked in gray and displays devices added using a special distribution. This distribution connects devices to the server.
There is also an information line with the total number of devices in the company.

Zone "Gas Station Columns Summary"
The "Gas Station Columns Summary" zone provides a brief overview of the number of gas station columns used by this company/user. All used devices have specific statuses.
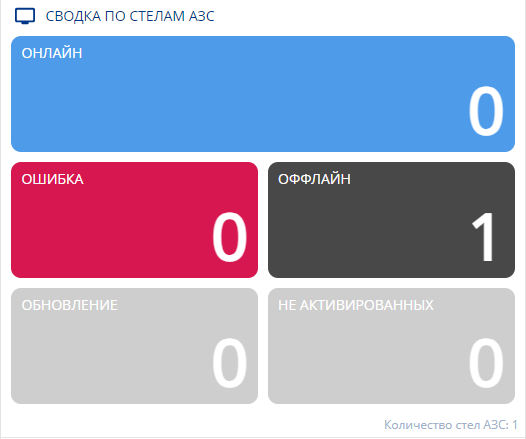
Statuses used in this zone:
- Online - marked in green and shows the number of columns online.
- Offline - marked in black and shows the number of columns offline.
- Error - marked in red and shows the number of columns that encountered an error during operation.
- Updating - marked in gray and shows the number of columns being updated.
- Not activated - marked in gray and shows the number of non-activated columns.
There is also an information line with the total number of columns in the company.

Zone "Schedule Summary"
The "Schedule Summary" zone provides a brief overview of the number of schedules used on the devices of this company/user. The displayed information is divided into three main blocks and one additional block.
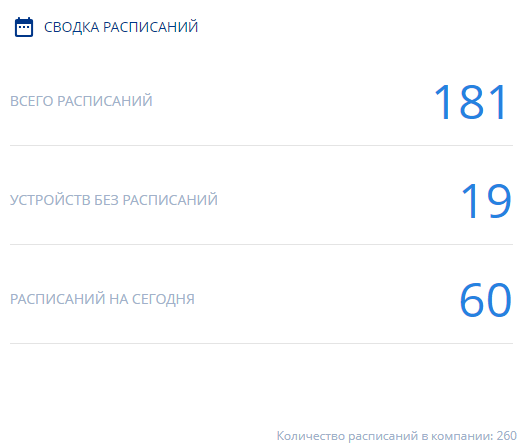
Main blocks:
- Total schedules - displays the total number of schedules on all devices of the company/user.
- Devices without a schedule - displays the total number of devices without schedules at the company/user.
- Schedules for today - displays the number of schedules used today on the devices of the company/user.
The additional block is called - "Number of schedules on devices".

"Storage Usage Statistics" Area
The "Storage Usage Statistics" area provides a brief summary of the use of internal storages in the company/user's personal account. The displayed information will be divided into statistical and functional.
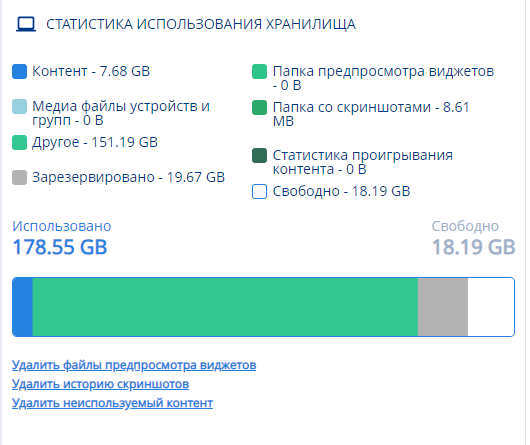
Statistical Information:
- Content - the total volume of content used within the storage. Measured in GB. Graphically marked in blue on the scale.
- Media Files of Devices and Groups - the total volume of media content located directly on the server itself. This data is not in the SmartPlayer system. Measured in GB. Graphically marked in turquoise on the scale.
- Other - the total volume of files that do not fall under the main categories. It includes: OS, system files, third-party programs. Measured in GB. Graphically marked in bright green on the scale.
- Reserved - the total volume of unallocated memory. Measured in GB. Graphically marked in gray on the scale.
- Widget Preview Folder - the total volume allocated for the widget preview function. Measured in GB. Graphically marked in light green on the scale.
- Screenshot Folder - the total volume allocated for screenshots. Measured in GB. Graphically marked in green on the scale.
- Content Playback Statistics - the total volume allocated for information related to the data being played. Measured in GB. Graphically marked in dark green on the scale.
Scale Statistical Information: Used - the total volume of used memory. Marked in blue on the scale. Free - the total free memory volume. Marked in white on the scale.
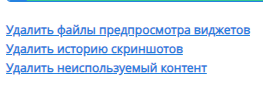
The functional part is represented by three capabilities:
- Delete Widget Preview Files - deletes data from the widget preview folder and resets the counter.
- Delete Screenshot History - deletes data from the screenshot folder, which were obtained from the device, and resets the counter.
- Delete Unused Content - deletes content that has not been used in the system for more than two weeks.
Zone "Server traffic statistics for the current day"
"Server Traffic Statistics for the Current Day" Area provides a brief overview of the incoming and outgoing traffic in the personal account for the day.
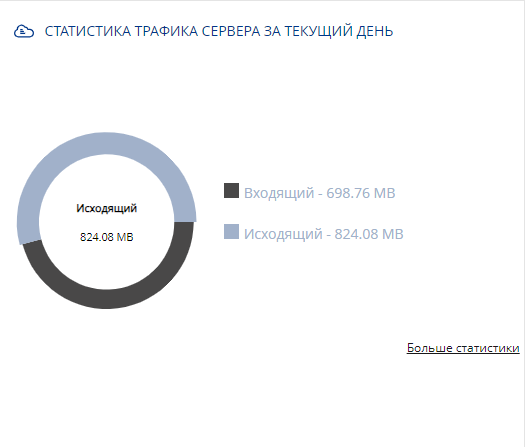
The traffic statistics for the current day are divided into two areas: Incoming Traffic - the volume of information coming into the personal account.
- Outgoing Traffic - the volume of information sent from the personal account.
Hovering over one of the areas highlights it and provides detailed information about specific traffic volumes.
Within this area, there is a clickable button in the bottom right labeled "More Statistics". Clicking on it will open a window where you need to set the parameters for the report.
The report parameters include::
- Start Date - the starting point for creating the report.
- End Date - the ending point for creating the report.
After setting these parameters, you can click the "Create Report" button, and the system will compile and gather data for the intervals set by the user. If this action is not needed, you can click the "Close" button.
After compiling the report, the user will be redirected to another page with traffic reports.

After creating a report, you can click on it and perform several actions in the right toolbar:
- Download Report
- Delete Report
- Close Toolbar Window
User Summary Zone
"User Summary" Area provides a brief overview of user data.
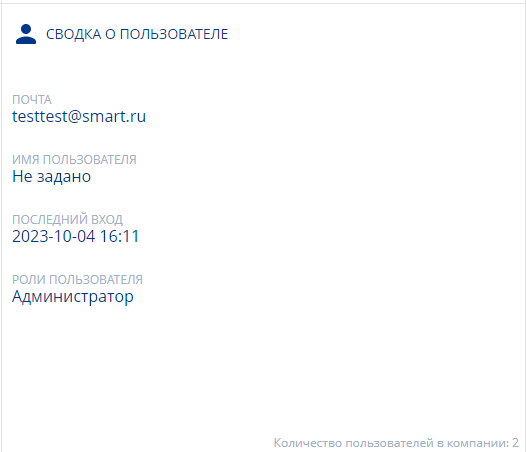
This data includes:
- Email - the email address associated with the personal account
- Username - the user's name within the personal account
- Last Login - indicates the date of the last login
- Administrator Roles - the role assigned to the user in the personal account
In this area, there is information about the total number of users in the company. It is located in the bottom right of this zone.

"Active Sessions" Area
The "Active Sessions" area provides a brief overview of users accessing the personal account.

This information includes:
- IP Address - logs the user's IP address
- Tabs - indicates the number of open tabs
- User Agent - provides brief information about the user's system and browser
Also, if several users access the personal account simultaneously, all of them and their data will be reflected in this area simultaneously.
General information area
The "General Information" Area includes clickable buttons and overview data.

The clickable buttons include:
- Documentation - a link that redirects to the official SmartPlayer Wiki. Located at the bottom left of the page.
- Refresh - this button updates the server information. Located at the bottom left. Updates automatically every 10 minutes, as indicated next to the button. The timer resets when navigating to another section and returning back to the "Overview" section, as well as when refreshing the page (pressing the "F5" key).
In this area, there's also a warning about passwords, indicating that all users will be logged out and "kicked out" of all sessions when the password is changed.

Final Result
The user knows and understands the information provided by the "Overview" section of the personal account and knows how to utilize the features of this section.