Translations:DebugSmartPlayer/45/en
Материал из SmartPlayer
Receiving debug messages from your personal account
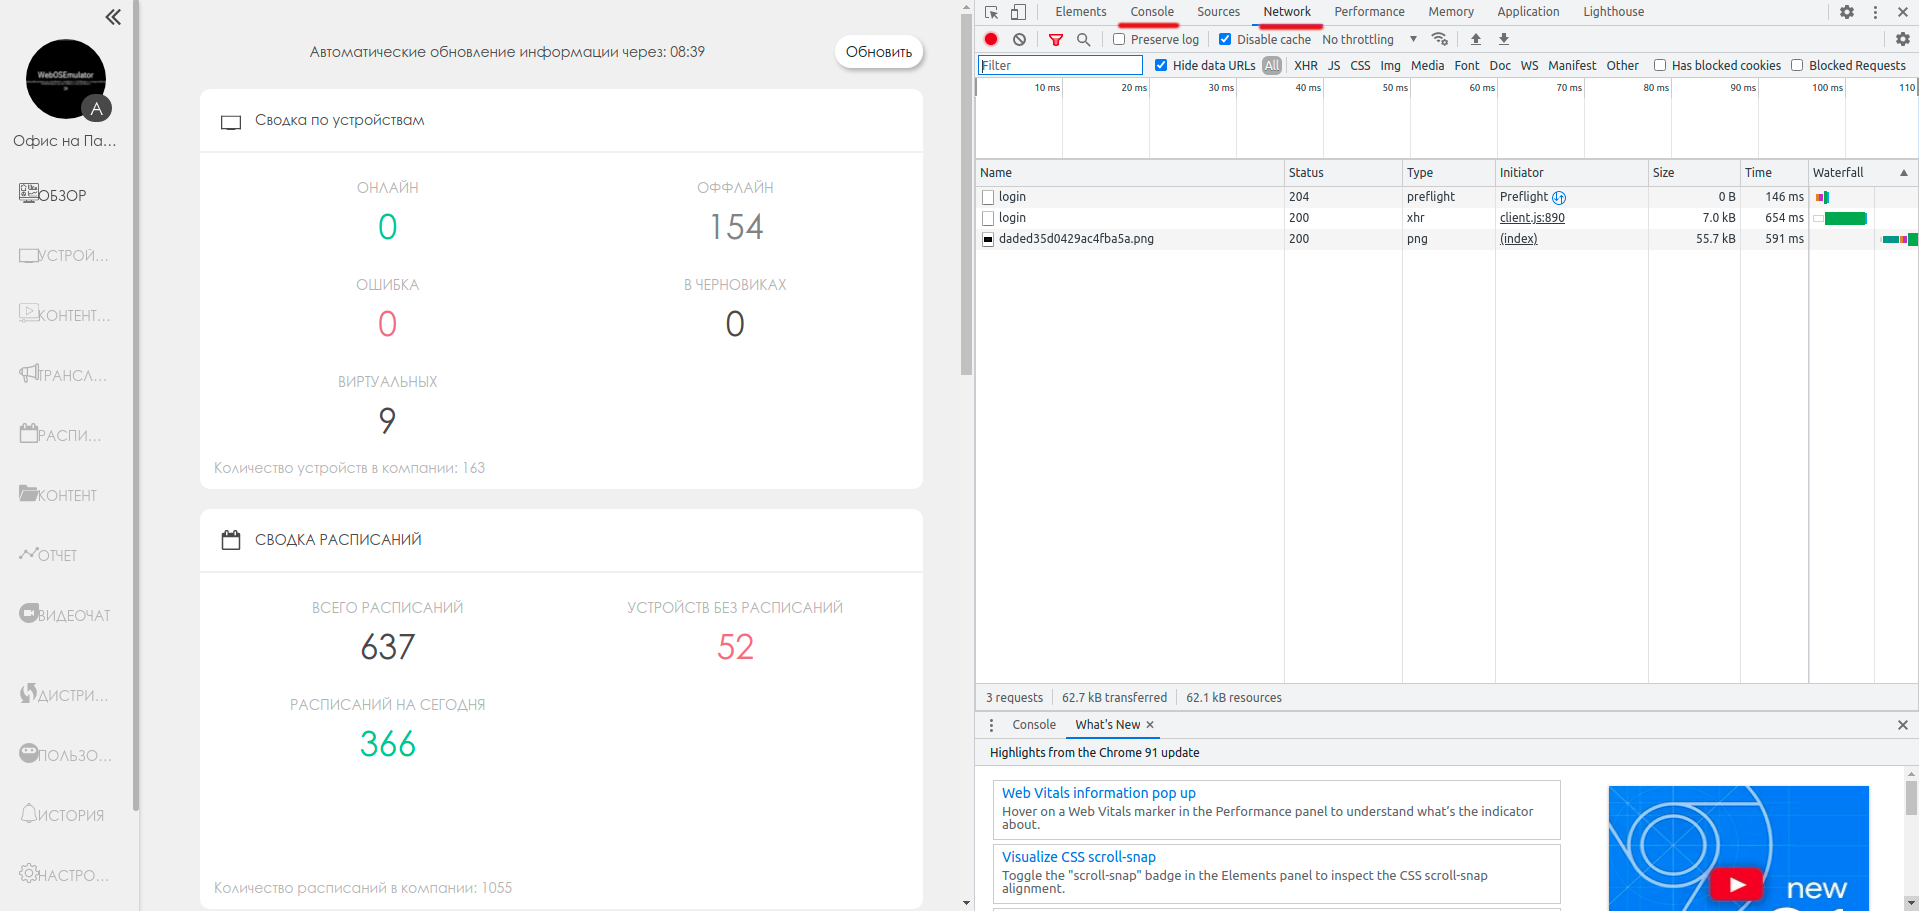
To analyze what is happening in your personal account, it is enough to provide information from two tabs of the browser debugging tools (Network and Console). Open the debugging tools in the Google Chrome browser by pressing F12, then take an action that causes incomprehensible behavior. After that, take a photo in readable quality of the Network and Console tabs. Next, send the details to support@smartplayer.org or the person in charge of support in your case.
