Online Monitoring
Situation Description
In the SmartPlayer platform, there's a feature to view what's happening with the device during playback, using the "Online Monitoring" functionality. This can help identify issues in the device's operation, and the user can obtain data about the joint operation of the device and platform in real-time.
Operational Logic
The user can find out the status of the stela as needed using the "Online Monitoring" functionality. They need to:
- In the personal account, go to the "Devices" section.
- Next, by clicking on the device that is online (highlighted with a green frame), the user needs to go to the sidebar that appeared on the right.
- In the sidebar, they need to select the "Information" line and click on it.
- After clicking on the "Information" line, a new window will open. In this window, the user needs to pay attention to the bottom left corner, where there is a panel that allows interaction with the device in online mode.
- The final step: in this panel, select the icon in the form of a display, named "Monitoring" and click on it.

Operating Principle
After opening the "Monitoring" window, the user will see an empty loading window. After a short interval, information collected about the device will appear in this window.

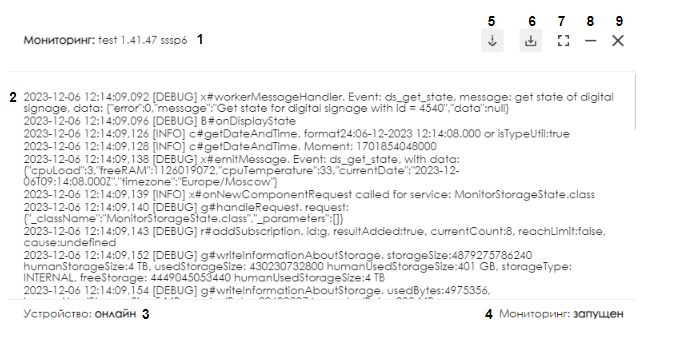
Upon opening the "monitoring" section window, the user can see data and information about the device, as well as additional descriptions and options for interacting with the monitoring.

The monitoring window can be divided into:
- Monitoring name.
- Data and information about the device.
- Device status.
- Monitoring status.
- Enabling/disabling automatic scrolling of current logs while working with the monitoring window.
- Log download. Downloads a file with all data displayed on the screen.
- Expand to full screen. Expands the monitoring window to full screen.
- Minimize the monitoring window to a small window. Can work in the background and even after closing the "Device Information" window. Allows using the mini version of the "Monitoring" window while working with the platform.
- Close the monitoring window. Closes the "Monitoring" window with logs, but does not stop their recording in the system. When opened next time, the user will see the current logs, the rest will go to the archive.
Downloaded Log File
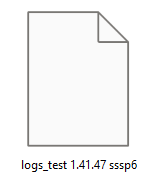
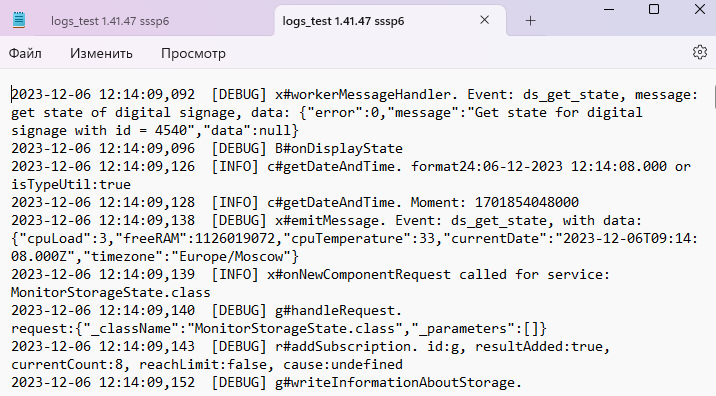
When clicking on the "Log Download" button, a file with logs is downloaded to the user's personal device. This file is accessible in the "downloads" section of the browser.

It can be opened and viewed using a text editor, such as Notepad.

Final Result
The user knows how to use the "Online Monitoring" functionality on devices that are online and knows how to collect a file with the device's logs.