Updated Design of Device Information
Situation Description
The SmartPlayer team has updated the UI and UX parts of the "Information" section for devices. This article describes what data a device provides under the updated design.
Steps to Follow
The first step for the user is to register / log in to the SmartPlayer personal account.
Next, the user needs to go to the "Devices" section and select the desired device.
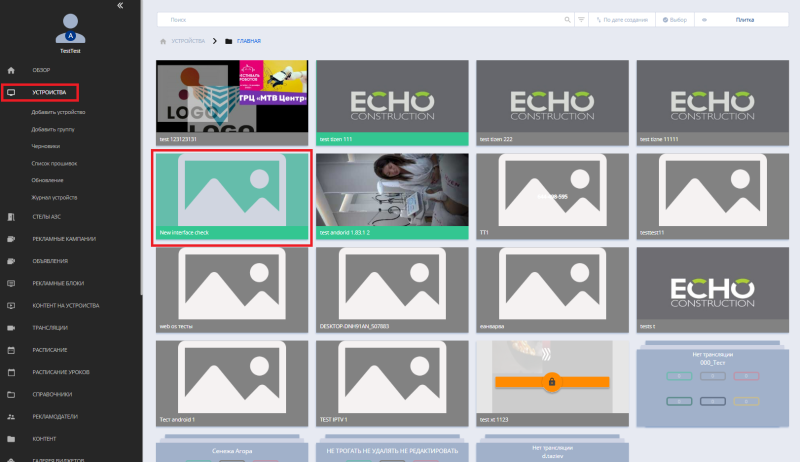
After clicking on the desired device, a toolbar will appear on the right side of the screen.
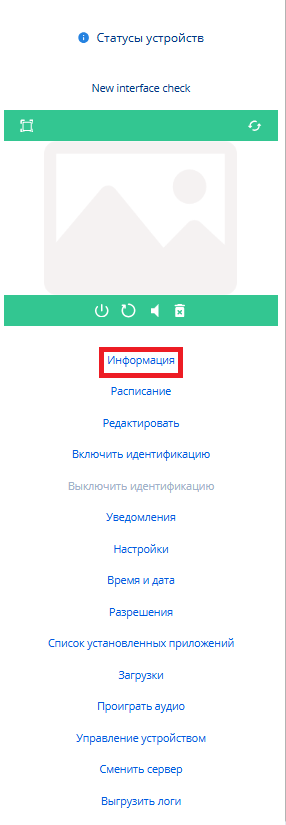
The user needs to click on the "Information" line and go to a page with the full information about the device.
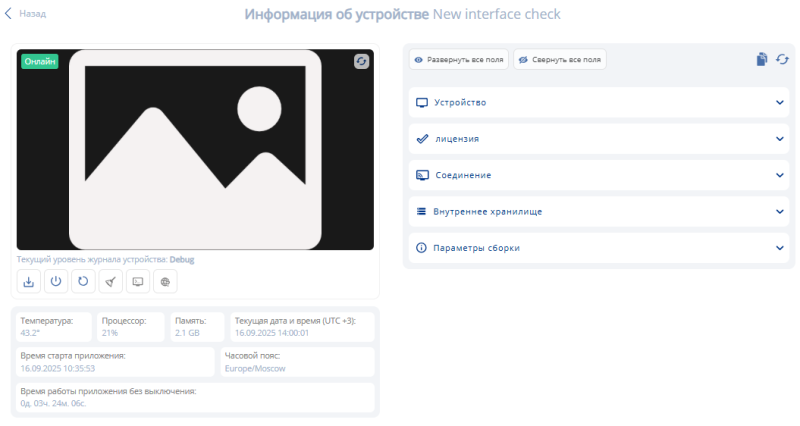
Device "Information" Page
The updated "Information" page includes the following blocks:
- Screenshot window.
- Functional buttons for device interaction.
- Device performance information.
- Available device information.
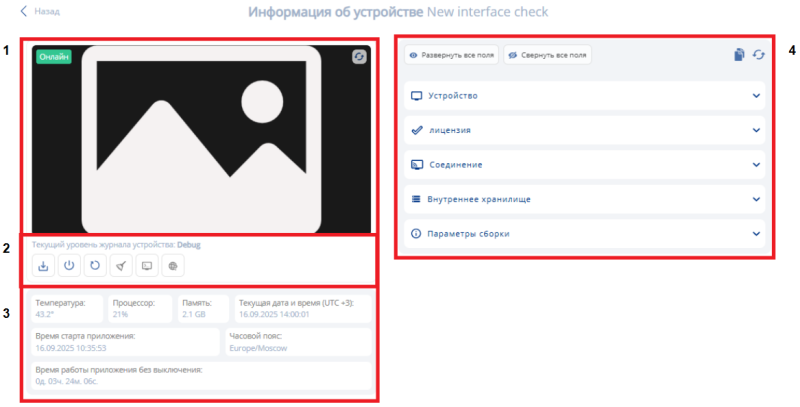
Below is a detailed description of each block.
Screenshot Window
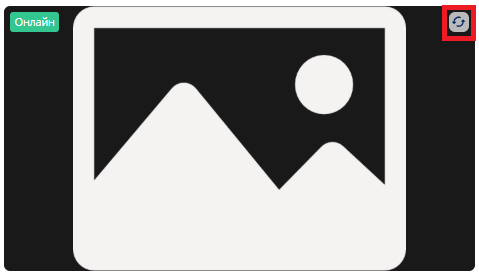
This block allows taking a screenshot of the currently playing content. It consists of two elements:
- preview window;
- screenshot button.
Functional Buttons for Device Interaction
In this block, the user can directly interact with and control the device using a panel of operation buttons. The list of available buttons (listed left to right):
- Device log — allows exporting device logs. Two types available: full (for all time) and recent;
- Power — allows turning the device off or putting it into sleep mode;
- Restart — allows restarting either the device or the client application installed on the device;
- Clear — allows deleting data from the device. Three types of clearing are available: files, local storage, statistics;
- Monitoring — allows viewing logs in real time. Also available: following the latest log line, exporting logs, expanding logs to fullscreen, collapsing logs, closing the logs window.
- Web engine info — allows the user to get information about the device and the version of its web engine in a separate window.

Device Performance Information
This block includes information and data that allow understanding how the device is running. It includes the following parameters:
- temperature;
- CPU load;
- memory usage;
- current date and time (UTC +3);
- application start time;
- time zone;
- uptime of the application without shutdown.

Available Device Information
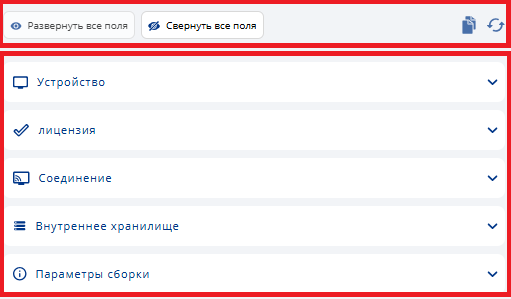
This block is the largest and includes control interface buttons and five major categories:
- “Expand all fields” button — expands all fields on the page;
- “Collapse all fields” button — collapses all expanded fields on the page;
- “Copy to clipboard” button — copies all information from the fields below (can be pasted into a text editor);
- “Refresh all device data” button — sends a request to the server and updates all current device data;
- “Device” category — includes device-specific data sent to the dashboard;
- “License” category — includes data related to the device's license;
- “Connection” category — includes information about the device’s network performance;
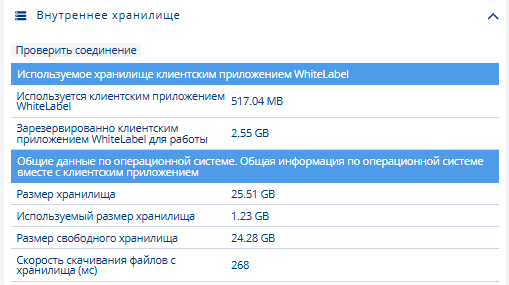
- “Internal Storage” category — includes information about internal storage;
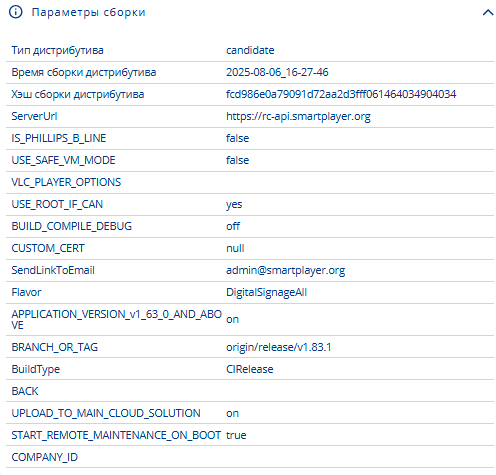
- “Build Parameters” category — includes data related to the build of the client application installed on the device.
“Device” Category
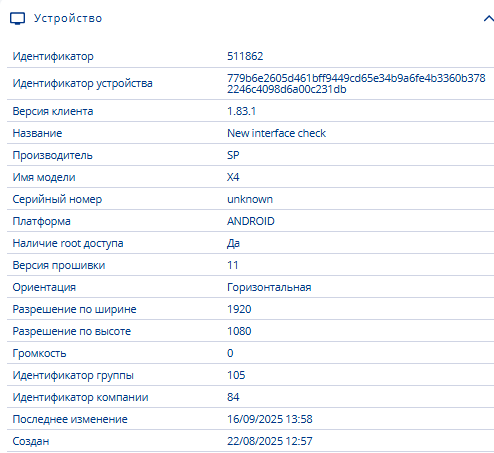
This category contains the following information:
- ID (device identifier in the database);
- device identifier;
- client version;
- device name;
- manufacturer;
- model name;
- serial number;
- platform;
- root access status;
- firmware version;
- orientation;
- resolution width;
- resolution height;
- date of last screenshot;
- last screenshot (link to screenshot in storage);
- volume;
- group ID (the identifier of the device group in the database);
- company ID;
- last modification date;
- created date.
“License” Category
This category contains the following information:
- license ID;
- license type;
- purchase date.

“Connection” Category
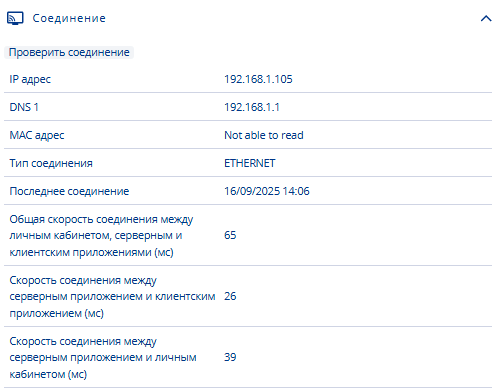
This category contains the following information:
- a “Check Connection” button (clicking adds additional items to the category, which will be described below);
- IP address (the device’s unique network identifier);
- DNS 1 (first DNS address);
- MAC address (local network address);
- connection type (wired Ethernet or wireless Wi-Fi);
- overall latency between dashboard, server, and client application (measured in milliseconds – ms). (Displayed after clicking the “Check Connection” button);
- latency between server application and client application (ms) (Displayed when clicking the “Check Connection” button);
- latency between server application and dashboard (ms) (Displayed when clicking the “Check Connection” button).
“Internal Storage” Category
This category carries the following information:
- “Check Connection” button (clicking adds an additional item to the category, listed below);
- used by the WhiteLabel client application
- reserved by the WhiteLabel client application for operation
- storage size;
- used storage size;
- available storage size;
- file download speed from storage, measured in milliseconds (ms). (Displayed after clicking the “Check Connection” button).
“Build Parameters” Category
This category carries the following information:
- distribution type;
- build time of the distribution;
- build hash (hash sum of the distribution build).
- “More Details” button (opens additional parameters related to the distribution build)
Video Instruction
Updated device “Information” screen design
Additional Information
If this article does not help you use the functionality as intended or if you have remaining questions after reading, you can raise them in the “Discussions” section at the top of the page.

Additional information can also be found on the page Как взаимодействовать пользователю с разделом "Обсуждения"