DebugSmartPlayer/en: различия между версиями
Новая страница: «You will be taken to a page with a table and a button to copy it. Click the "Copy table" button and pass the information to the employee who requested it. безрамки|центр» |
Новая страница: «==<span id="howIcanGetServerUrl">How to find out the address / version of the server in the platform and personal account SmartPlayer</span>== To determine the address of the server application, you need to go to your personal account безрамки|центр and go to the "Settings" tab, scroll down the page and click the "About software" hyperlink. Файл:Screenshot from 2024-06-03 17-58-21.png|б...» |
||
| Строка 87: | Строка 87: | ||
[[Файл:DebugConsoleBrowser.png|мини|центр]] | [[Файл:DebugConsoleBrowser.png|мини|центр]] | ||
==<span id="howIcanGetServerUrl"> | ==<span id="howIcanGetServerUrl">How to find out the address / version of the server in the platform and personal account SmartPlayer</span>== | ||
To determine the address of the server application, you need to go to your personal account | |||
[[Файл:Screenshot from 2024-06-03 17-56-18.jpg|безрамки|центр]] | [[Файл:Screenshot from 2024-06-03 17-56-18.jpg|безрамки|центр]] | ||
and go to the "Settings" tab, scroll down the page and click the "About software" hyperlink. | |||
[[Файл:Screenshot from 2024-06-03 17-58-21.png|безрамки|центр]] | [[Файл:Screenshot from 2024-06-03 17-58-21.png|безрамки|центр]] | ||
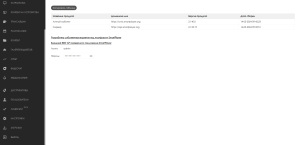
You will be taken to a page with a table and a button to copy it. Click the "Copy table" button and pass the information to the employee who requested it. | You will be taken to a page with a table and a button to copy it. Click the "Copy table" button and pass the information to the employee who requested it. | ||
[[Файл:Screenshot from 2024-06-03 17-59-23.png|безрамки|центр]] | [[Файл:Screenshot from 2024-06-03 17-59-23.png|безрамки|центр]] | ||
Версия от 16:38, 6 октября 2024
Debugging Tools
SmartPlayer platform provides many tools for debugging when an abnormality occurs.
== Receiving log from device (logs) == Each client application writes an event log to its internal memory of the device, if necessary, it can be obtained and sent for analysis to SmartPLayer technical support, in order to get the most useful logs, do the following:
- In the device settings (Select device -> In the right toolbar Settings), when it is online (green), enable the Debug or Trace logging mode. This will configure the device so that it writes more detailed messages about its work.
- Try to reproduce the abnormal situation on the device
- Go to the device card (Select device -> In the right toolbar Information) and download the archive with the log.
There are two parameters:
- current - the archive with the event log for the current day will be unloaded, as a result of its smaller size. If the network is unstable, the best choice.
- full - the archive with the event log for several days will be unloaded. It can transmit a large amount of data, the network should be more stable.
== Cleaning the device == Cleaning the device, allows you to delete all application data recorded using the SmartPlayer software, these actions reset the application cache. Re-registering the device is not required. Go to the device card (Select device -> Information in the right toolbar) and click the "clear" icon, you will be offered two options:
- Delete all files on the device - this option to delete media files downloaded for offline playback of content. The next time you launch the application, if the current broadcast is not cached on the device, the files will be downloaded again.
- Clear local storage - this option will delete the metadata required for offline playback. The next time you launch the application, if there is not enough metadata for the current broadcast, it will be received from the SmartPlayer server.
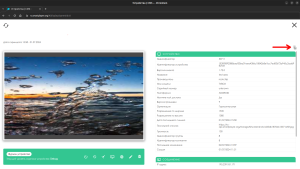
Данные скопируются в буфер обмена, для дальнейшей вставки в нужный докмуент.
Depending on the operating system of the client application, it will either be rebooted or restarted.
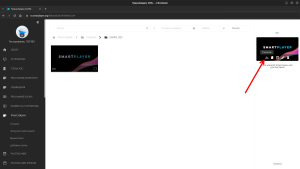
После начала скачивания, в зависимости от размера трансляции ожидаем её скачивание на рабочий компьютер. Далее необходимо без модификации передать архив при заведении заявки на портале технической поддержки.
Upload the operation log (logs) of a device on Android OS in offline mode
If the device does not connect to the server, check the device's access to the server first. To do this, it is enough to open the built-in browser on the Android OS device and drive in the server address. If the connection goes to https://cms.smartplayer.org, then type in https://api.smartplayer.org as a result, the message 'Cannot GET /' should appear, this indicates that the device "sees" server.
Determine which account the device belongs to (device modification)
To identify the device from the remote control, you must unlock the device (if the remote control is locked) and press the button "1" on the remote control, the application will show the interface in which:
- The name of the device is specified (similar to in your personal account)
- List of accounts participating in the company for which the device is registered
- How long will the information be hidden (in seconds)
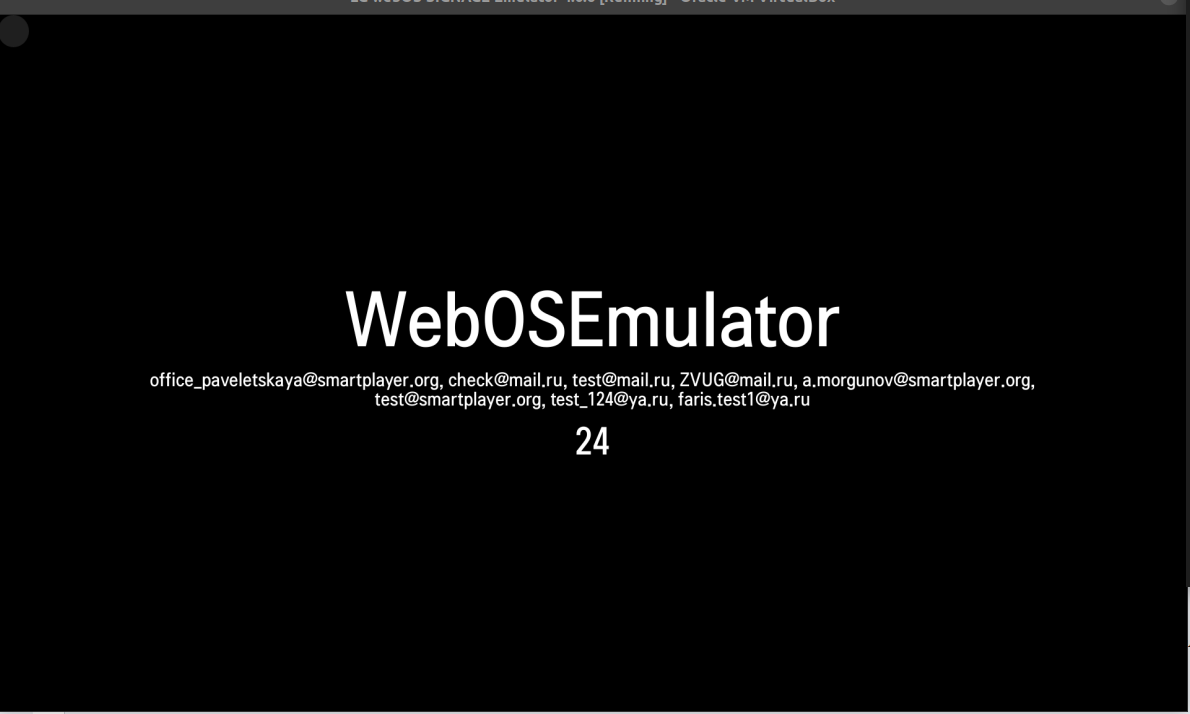
The interface can be hidden without waiting for the timer by pressing "2" on the remote control
Platform Support: WebOS / SSSP / BrightSign
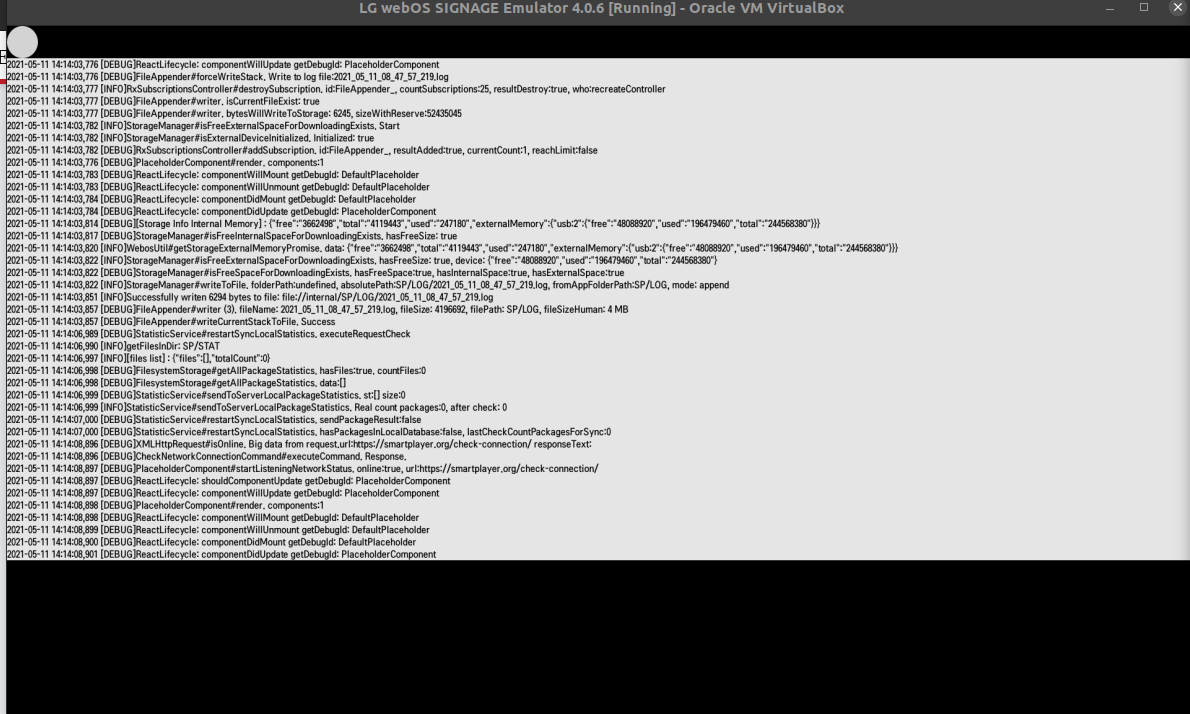
Local Console Display
Sometimes it is not clear what is happening with the device and there is no way to get logs through your personal account, then you need to launch the local debug console to receive messages about the problem.![]() For Android OS
For Android OS
For the local console of the device from the remote control, you need to unlock the device (if the remote control is locked) and press the "Blue" button on the remote control, then you need to take a picture in good resolution (to read the lines) and send the photo to support@smartplayer.org .
The interface can be hidden without waiting for the timer by pressing "Blue" on the remote
Platform Support: WebOS / SSSP / BrightSign
Receiving debug messages from your personal account
To analyze what is happening in your personal account, it is enough to provide information from two tabs of the browser debugging tools (Network and Console). Open the debugging tools in the Google Chrome browser by pressing F12, then take an action that causes incomprehensible behavior. After that, take a photo in readable quality of the Network and Console tabs. Next, send the details to support@smartplayer.org or the person in charge of support in your case.
Для открытия локальной консоли устройства с пульта необходимо разблокировать устройство (если заблокирован пульт) и нажать на кнопку "Blue" на пульте, далее необходимо сфотографировать в хорошем разрешении (чтобы читались строки) и прислать фото в support@smartplayer.org или сотруднику тех. поддержки SmartPlayer
Интерфейс можно скрыть, не дожидаясь таймера нажав "Blue" на пульте
Поддержка платформ: WebOS/SSSP/BrightSign
Получение отладочных сообщений от личного кабинета
Для анализа, что происходит в личном кабинете достаточно предоставить информацию с двух вкладок инструментов отладки браузера (Network и Console). Откройте в браузере Google Chrome инструменты отладки, нажав F12, далее произведите действие которое вызывает непонятное поведение. После этого скопируйте в текстовый файл вкладки Network и Console. Далее пришлите данные на support@smartplayer.org или ответственному человеку за поддержку в вашем случае в системе технической поддержки.
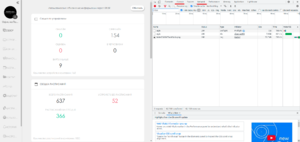
How to find out the address / version of the server in the platform and personal account SmartPlayer
To determine the address of the server application, you need to go to your personal account

and go to the "Settings" tab, scroll down the page and click the "About software" hyperlink.
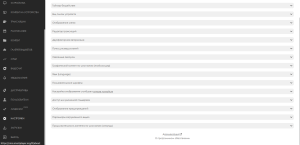
You will be taken to a page with a table and a button to copy it. Click the "Copy table" button and pass the information to the employee who requested it.
